- Tail utilization is a significant system issue and a major factor in overload-related failures and low compute utilization.
- The tail utilization optimizations at Meta have had a profound impact on model serving capacity footprint and reliability.
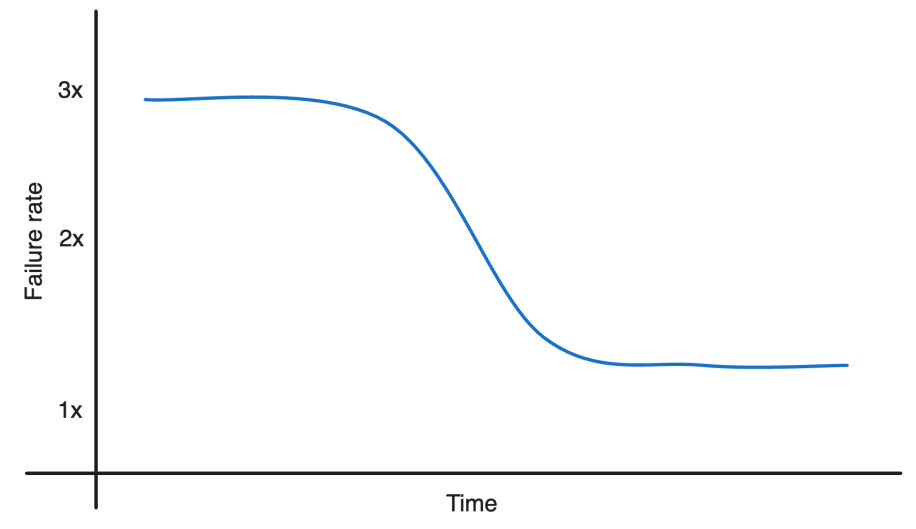
- Failure rates, which are mostly timeout errors, were reduced by two-thirds; the compute footprint delivered 35% more work for the same amount of resources; and p99 latency was cut in half.
The inference platforms that serve the sophisticated machine learning models used by Meta’s ads delivery system require significant infrastructure capacity across CPUs, GPUs, storage, networking, and databases. Improving tail utilization – the utilization level of the top 5% of the servers when ranked by utilization– within our infrastructure is imperative to operate our fleet efficiently and sustainably.
With the growing complexity and computational intensity of these models, as well as the strict latency and throughput requirements to deliver ads, we’ve implemented system optimizations and best practices to address tail utilization. The solutions we’ve implemented for our ads inference service have positively impacted compute utilization in our ads fleet in several ways, including increasing work output by 35 percent without additional resources, decreasing timeout error rates by two-thirds, and reducing tail latency at p99 by half.
How Meta’s ads model inference service works
When placing an ad, client requests are routed to the inference service to get predictions. A single request from a client typically results in multiple model inferences being requested, depending on experiment setup, page type, and ad attributes. This is shown below in figure 1 as a request from the ads core services to the model inference service. The actual request flow is more complex but for the purpose of this post, the below schematic model should serve well.
The inference service leverages Meta infrastructure capabilities such as ServiceRouter for service discovery, load balancing, and other reliability features. The service is set up as a sharded service where each model is a shard and multiple models are hosted in a single host of a job that spans multiple hosts.
This is supported by Meta’s sharding service, Shard Manager, a universal infrastructure solution that facilitates efficient development and operation of reliable sharded applications. Meta’s advertising team leverages Shard Manager’sload balancing and shard scaling capabilities to effectively handle shards across heterogeneous hardware.
Challenges of load balancing
There are two approaches to load balancing:
- Routing load balancing – load balancing across replicas of a single model. We use ServiceRouter to enable routing based load balancing.
- Placement load balancing – balancing load on hosts by moving replicas of a model across hosts.
Fundamental concepts like replica estimation, snapshot transition and multi-service deployments are key aspects of model productionisation that make load balancing in this environment a complex problem.
Replica estimation
When a new version of the model enters the system, the number of replicas needed for the new model version is estimated based on historical data of the replica usage of the model.
Snapshot transition
Ads models are continuously updated to improve their performance. The ads inference system then transitions traffic from the older model to the new version. Updated and refreshed models get a new snapshot ID. Snapshot transition is the mechanism by which the refreshed model replaces the current model serving production traffic.
Multi-service deployment
Models are deployed to multiple service tiers to take advantage of hardware heterogeneity and elastic capacity.
Why is tail utilization a problem?
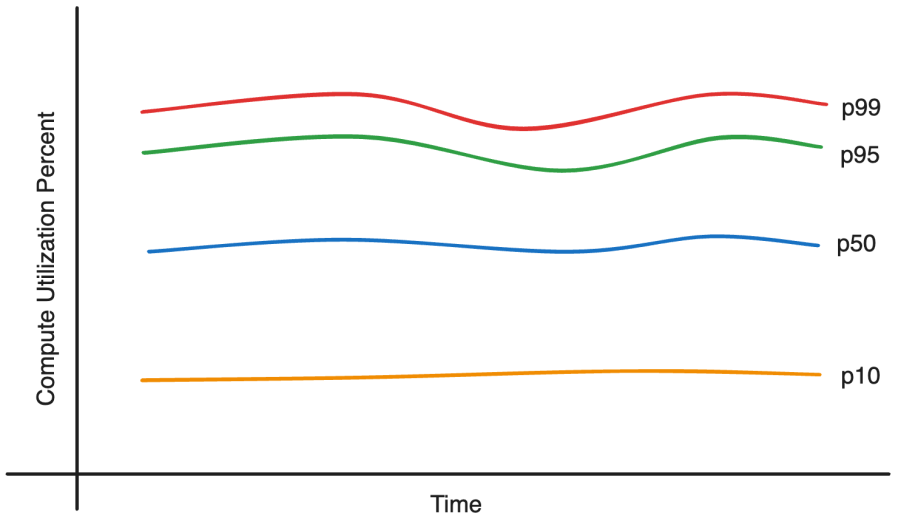
Tail utilization is a problem because as the number of requests increases, servers that contribute to high tail utilization become overloaded and fail, ultimately affecting our service level agreements (SLAs). Consequently, the extra headroom or buffer needed to handle increased traffic is directly determined by the tail utilization.
This is challenging because it leads to overallocation of capacity for the service. If demand increases, capacity headroom is necessary in constrained servers to maintain service levels when accommodating new demand. Since capacity is uniformly added to all servers in a cluster, generating headroom in constrained servers involves adding significantly more capacity than required for headroom.
In addition, tail utilization for most constrained servers grows faster than lower percentile utilization due to the non linear relationship between traffic increase and utilization. This is the reason why more capacity is needed even while the system is under utilized on average.
Making the utilization distribution tighter across the fleet unlocks capacity within servers running at low utilization, i.e. the fleet can support more requests and model launches while maintaining SLAs.
How we optimized tail utilization
The implemented solution comprises a class of technical optimizations that attempt to balance the objectives of improving utilization and reducing error rate and latency.
The improvements made the utilization distribution tighter. This created the ability to move work from crunched servers to low utilization servers and absorb increased demand. As a result, the system has been able to absorb up to 35% load increase with no additional capacity.
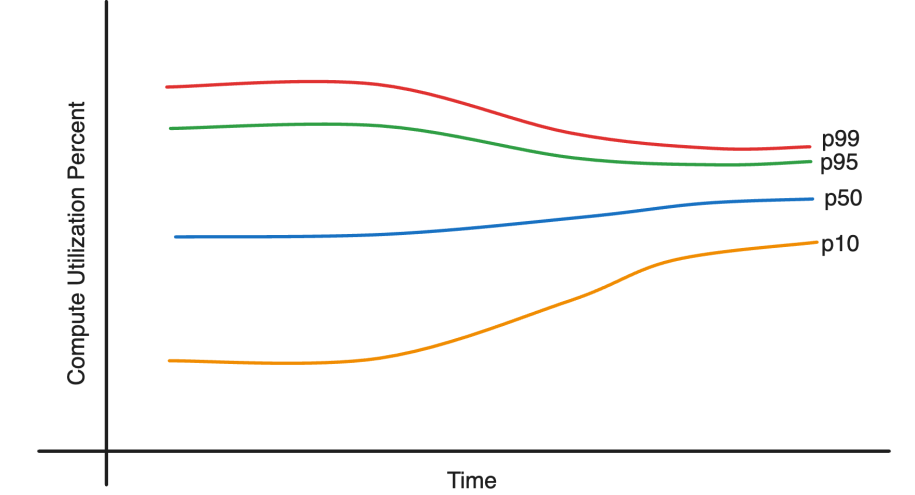
The reliability also improved, reducing the timeout error rate by two-thirds and cutting latency by half.
The solution involved two approaches:
- Tuning load balancing mechanisms
- Making system level changes in model productionisation.
The first approach is well understood in the industry. The second one required significant trial, testing, and nuanced execution.
Tuning load balancing mechanisms
The power of two choices
The service mesh, ServiceRouter, provides detailed instrumentation that allows a better understanding of the load balancing characteristics. Specifically relevant to tail utilization is suboptimal load balancing because of load staleness. To address this we leveraged the power of two choices in a randomized load balancing mechanism. This algorithm requires load data from the servers. This telemetry is collected either by polling – query server load before request dispatch; or by load-header – piggyback on response.
Polling provides fresh load, while it adds an additional hop, but on the other side, load-header results in reading stale load. Load staleness is a significant issue for large services with substantial clients. Any error here due to staleness would result in random load balancing. For polling, given the inference request is computationally expensive, the overhead was found to be negligible. Using polling improved tail utilization noticeably because heavily loaded hosts were actively avoided. This approach worked very well specifically for inference requests greater than 10s of milliseconds.
ServiceRouter provides various tuning load-balancing capabilities. We tested many of these techniques, including the number of choices for server selection (i.e., power of k instead of 2), backup request configuration, and hardware-specific routing weights.
These changes offered marginal improvements. CPU utilization as load-counter was especially insightful. While it is intuitive to balance based on CPU utilization, it turned out to be not useful because: CPU utilization is aggregated over some period of time versus the need for instant load information in this case; and outstanding active tasks waiting on I/O were not taken into account correctly.
Placement load balancing
Placement load balancing helped a lot. Given the diversity in model resource demand characteristics and machine resource supply, there is significant variance in server utilization. There is an opportunity to make the utilization distribution tighter by tuning the Shard Manager load balancing configurations, such as load bands, thresholds, and balancing frequency. The basic tuning above helped and provided big gains. It also exposed a deeper problem like spiky tail utilization, which was hidden behind the high tail utilization and was fixed once identified .
System level changes
There wasn’t a single significant cause for the utilization variance and several intriguing issues emerged among them that offered valuable insights into the system characteristics.
Memory bandwidth
CPU spikes were observed when new replicas, placed on hosts already hosting other models, began serving traffic. Ideally, this should not happen because Shard Manager should only place a replica when the resource requirements are met. Upon examining the spike pattern, the team discovered that the stall cycles were increasing significantly. Using dynolog perf instrumentations, we determined that memory latency was increasing as well, which aligned with memory latency benchmarks.
Memory latency starts to increase exponentially at around 65-70% utilization. It appears to be an increase in CPU utilization, but the actual issue was that the CPU was stalling. The solution involved considering memory bandwidth as a resource during replica placement in Shard Manager.
ServiceRouter and Shard Manager expectation mismatch
There is a service control plane component called ReplicaEstimator that performs replica count estimation for a model. When ReplicaEstimator performs this estimation, the expectation is that each replica roughly receives the same amount of traffic. Shard Manager also works under this assumption that replicas of the same model will roughly be equal in their resource usage on a host. Shard Manager load balancing also assumes this property. There are also cases where Shard Manager uses load information from other replicas if load fetch fails. So ReplicaEstimator and Shard Manager share the same expectation that each replica will end up doing roughly the same amount of work.
ServiceRouter employs the default load counter, which encompasses both active and queued outstanding requests on a host. In general, this works fine when there is only one replica per host and they are expected to receive the same amount of load. However, this assumption is broken due to multi-tenancy, resulting in each host potentially having different models and outstanding requests on a host cannot be used to compare load as it can vary greatly. For example, two hosts serving the same model could have completely different load metrics leading to significant CPU imbalance issues.
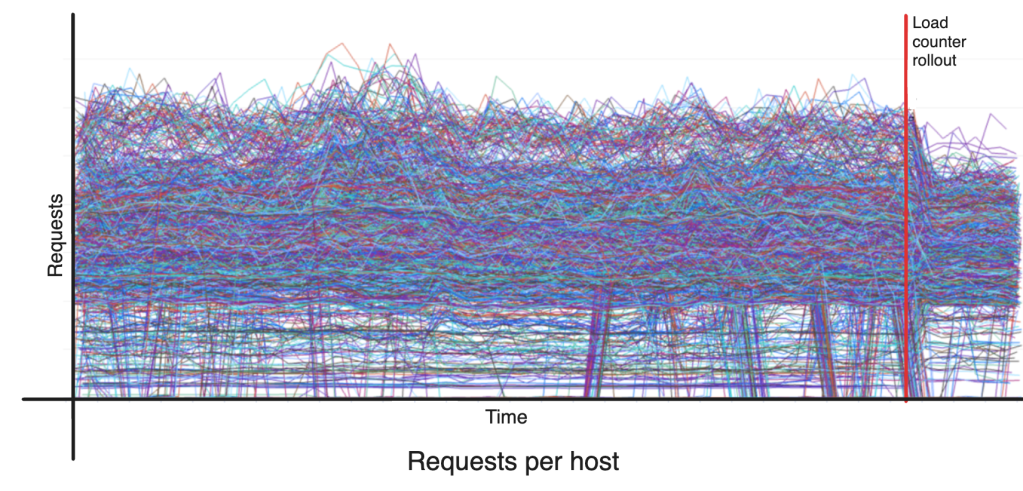
The imbalance of replica load created because of the host level consolidated load counter violates Shard Manager and ReplicaEstimator expectations. A simple and elegant solution to this problem is a per-model load counter. If each model were to expose a load counter based on its own load on the server, ServiceRouter will end up balancing load across model replicas, and Shard Manger will end up more accurately balancing hosts. Replica estimation also ends up being more accurate. All expectations are aligned.
Support for this was added to the prediction client by explicitly setting the load counter per model client and exposing appropriate per model load metric on the server side. The model replica load distribution as expected became much tighter with a per-model load counter and helps with the problems discussed above.
But this also presented some challenges. Enabling per-model load counter changes the load distribution instantaneously, causing spikes until Shard Manager catches up and rebalances. The team built a mechanism to make the transition smooth by gradually rolling out the load counter change to the client. Then there are models with low load that end up having per-model load counter values of ‘0’, making it essentially random. In the default load counter configuration, such models end up using the host level load as a good proxy to decide which server to send the request to.
“Outstanding examples CPU” was the most promising load counter among many that were tested. It is the estimated total CPU time spent on active requests, and better represents the cost of outstanding work. The counter is normalized by the number of cores to account for machine heterogeneity.
Snapshot transition
Some ads models are retrained more frequently than others. Discounting real-time updated models, the majority of the models involve transitioning traffic from a previous model snapshot to the new model snapshot. Snapshot transition is a major disruption to a balanced system, especially when the transitioning models have a large number of replicas.
During peak traffic, snapshot transition can have a significant impact on utilization. Figure 6 below illustrates the issue. The snapshot transition of large models during a crunched time causes utilization to be very unbalanced until Shard Manager is able to bring it back in balance. This takes a few load balancing runs because the placement of the new model during peak traffic ends up violating CPU soft thresholds. The problem of load counters, as discussed earlier, further complicates Shard Manager’s ability to resolve issues.
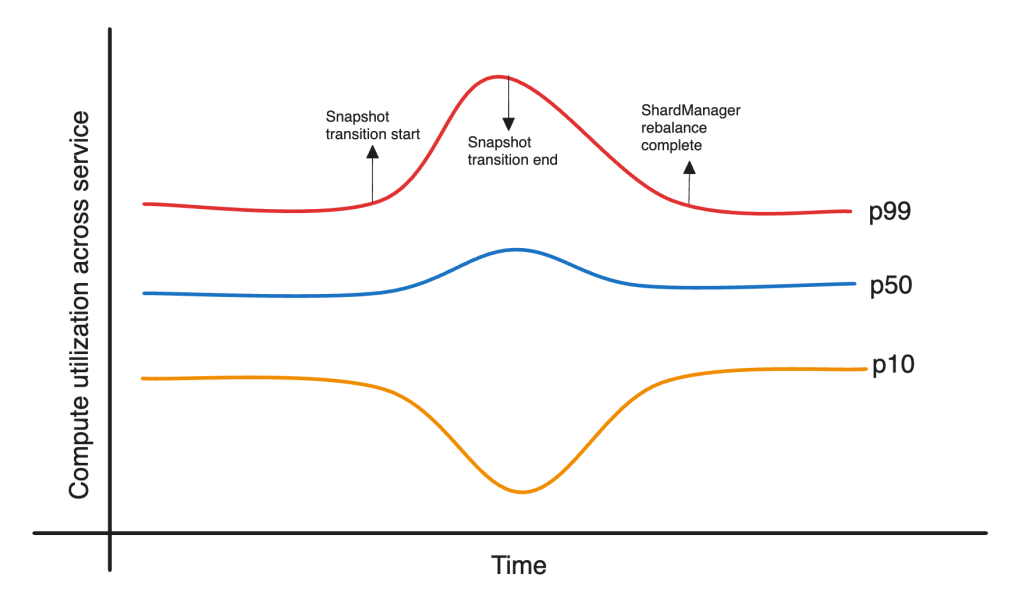
To mitigate this issue, the team added the snapshot transition budget capability. This allows for snapshot transitions to occur only when resource utilization is below a configured threshold. The trade-off here is between snapshot staleness and failure rate. Fast scale down of old snapshots helped minimize the overhead of snapshot staleness while maintaining lower failure rates.
Cross-service load balancing
After optimizing load balancing within a single service, the next step was to extend this to multiple services. Each regional model inference service is made up of multiple sub-services depending on hardware type and capacity pools – guaranteed and elastic pools. We changed the calculation to the compute capacity of the hosts instead of the host number. This helped with a more balanced load across tiers.
Certain hardware types are more loaded than others. Given that clients maintain separate connections to these tiers, ServiceRouter load balancing, which performs balancing within tiers, did not help. Given the production setup, it was non-trivial to put all these tiers behind a single parent tier. Therefore, the team added a small utilization balancing feedback controller to adjust traffic routing percentages and achieve balance between these tiers. Figure 7 shows an example of this being rolled out.

Replica estimation and predictive scaling
Shard Manager employs a reactive approach to load by scaling up replicas in response to a load increase. This meant increased error rates during the time replicas were scaled up and became ready. This is exacerbated by the fact that replicas with higher utilization are more prone to utilization spikes given the non-linear relationship between queries per second (QPS) and utilization. To add to this, when auto-scaling kicks in, it responds to a much larger CPU requirement and results in over-replication. We designed a simple predictive replica estimation system for the models that predicts future resource usage based on current and past usage patterns up to two hours in advance. This approach yielded significant improvements in failure rate during peak periods.
Next steps
The next step in our journey is to adopt our learnings around tail utilization to new system architectures and platforms. For example, we’re actively working to apply the utilizations discussed here to IPnext, Meta’s next-generation unified platform for managing the entire lifecycle of machine learning model deployments, from publishing to serving. IPnext’s modular design enables us to support various model architectures (e.g., for ranking or GenAI applications) through a single platform spanning multiple data center regions. Optimizing tail utilization within IPnext thereby delivering these benefits to a broader range of expanding machine learning inference use cases at Meta.


